Cape Town Homes estimates two things about where a home stands, its direct sunlight through the year and its shelter from the wind.
A sunny home can still be a windy one, so we work the two out separately. You'll find them on the listing's Sun and Wind tabs.
When does the sun reach it?
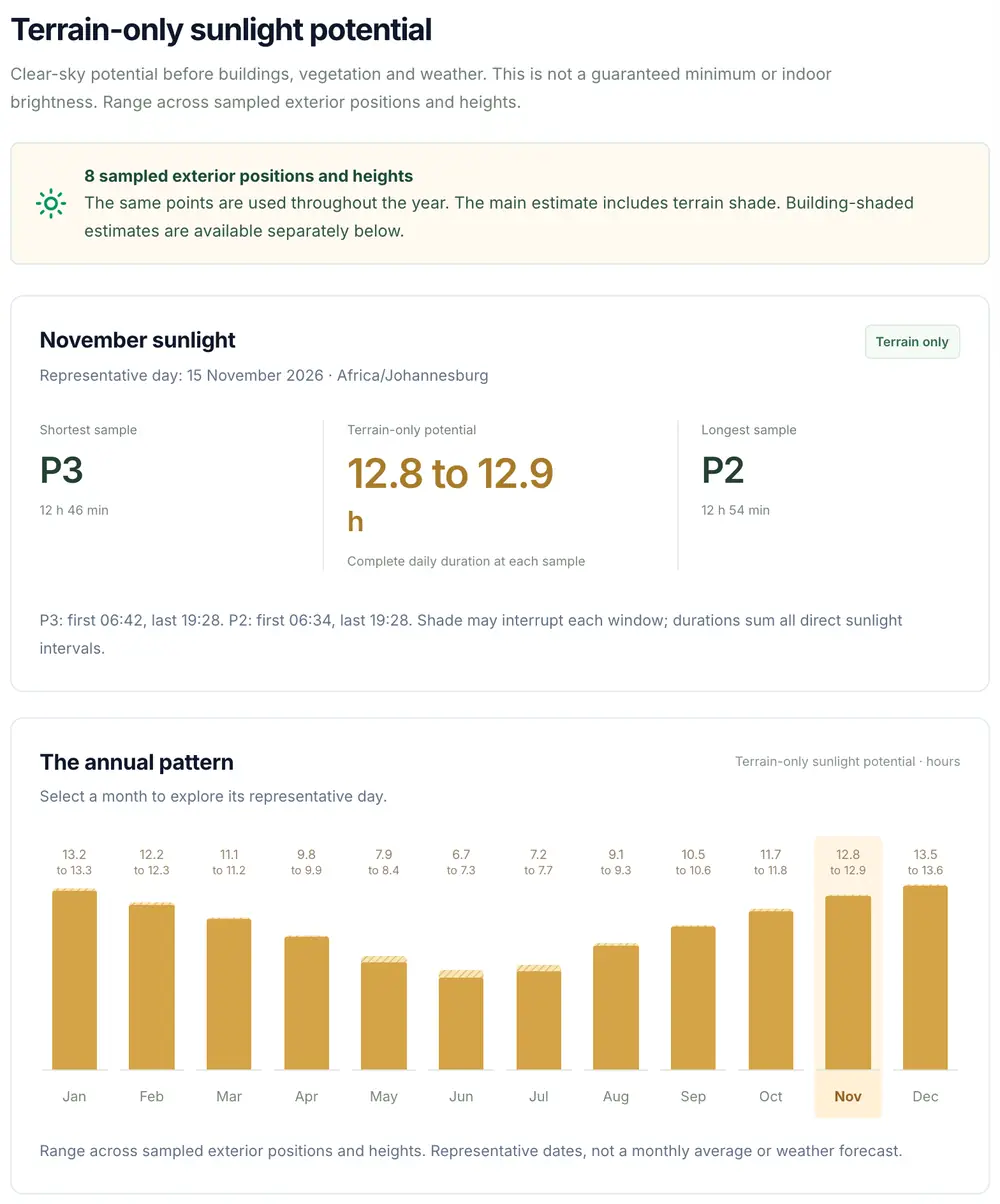
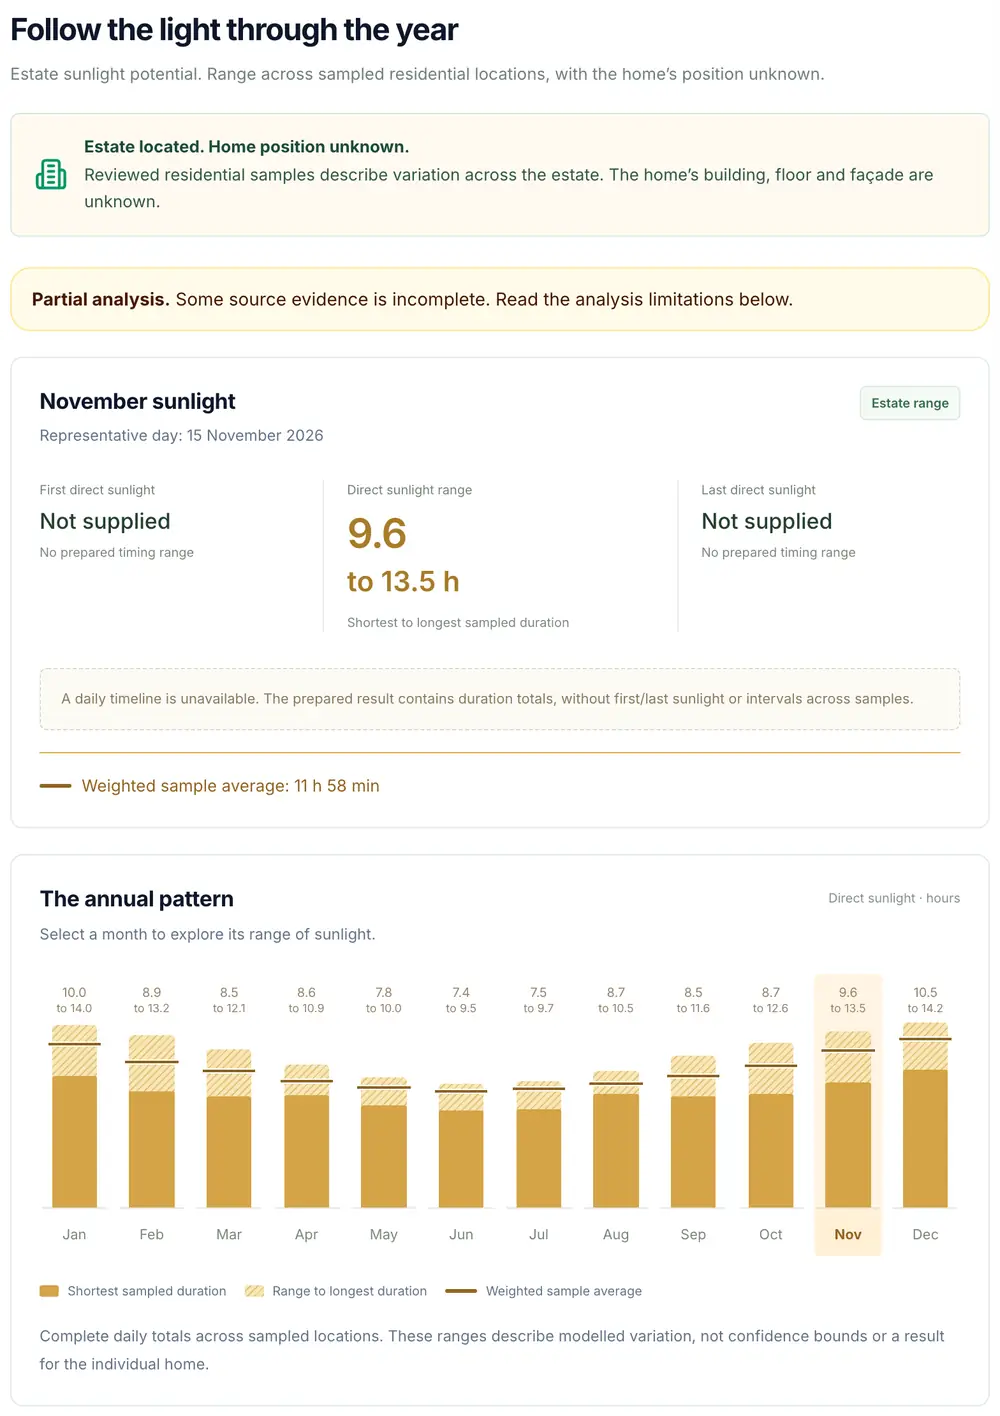
The Sun tab shows potential direct sunlight month by month. Where we assessed several positions or heights, it shows the range.
How sheltered is it?
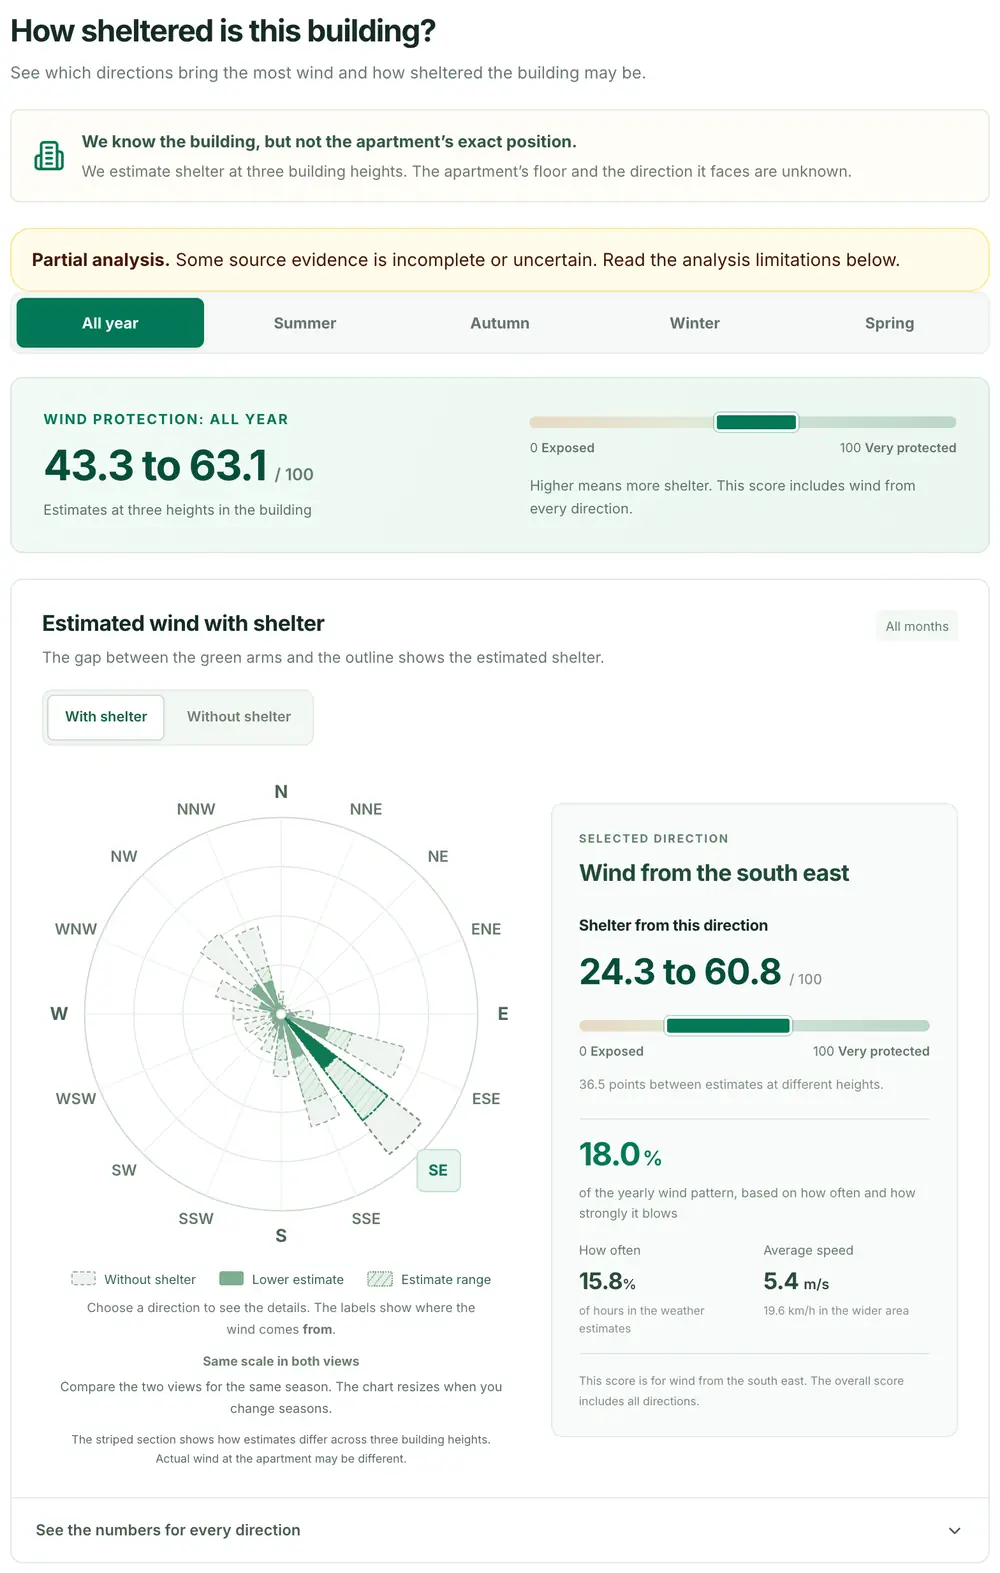
The Wind tab gives a wind protection score from 0 to 100 and shows the shelter from each wind direction beside the region's wind pattern.
Sunlight
How we estimate sunlight
Cape Town Homes compares the sun's path with the horizon around a home, mountain included.
The sunlight estimate is the time direct sun can reach an outdoor point, from the first direct sun of the day to the last.
Follow the sun through the year
The sun sits low in June and high in December. Monthly figures use the 15th of the month, and annual totals add up each day of the year.
Trace the horizon around the home
High ground can delay the first direct sun or take the last of it early. Where we know the property, or have reviewed its building or estate, mapped neighbouring buildings count too. Broader estimates count terrain only.
Show the range
When we know a home's building, estate or street but not its exact position, we estimate the sunlight at several places it could be. We calculate each one separately and show the lowest and highest result. When we know the exact house, there is usually one position and one figure.
We know the building, but the flat's exact position in it is unconfirmed. We estimate potential direct sunlight at several possible positions, then show the lowest and highest results.
Illustrative example
One building. Five possible positions.
Sample possible positions
Different positions and heights in the same building.
Select a position to follow its result.
Calculate sunlight at each position
SAST
Potential direct sun on 15 June.
05:0009:0013:0017:0021:00
Potential direct sunDaylight window
A08:35 to 15:006h 25m of potential direct sun
The range on the listing
6h 10mto7h 20m
The lowest and highest totals across all five sampled positions form the range.
ASelected position · second floor, middle · 6h 25m
6h7h8h
Lowest estimatePosition C · 6h 10m1h 10m between the extremesHighest estimatePosition B · 7h 20m
Select a position, sunlight bar or range marker to trace the same position.
What the range means. These are five possible locations for one home. Each location is calculated separately. The range is the minimum and maximum of those results, not their average.
Illustrative values. This drawing describes no real listing. Times are in South African Standard Time (UTC+2). The estimate describes outdoor sunlight potential, with cloud cover and indoor light outside its scope.
Wind
How we estimate wind shelter
Cape Town Homes combines ten years of regional wind records with the terrain and buildings around a home, and scores its shelter from 0 to 100.
The south-easter is a regional wind. Shelter from it is local, and can change from one street to the next.
Start with ten years of wind
Hourly NASA POWER records give the region's wind speed and direction. They describe the wider wind climate, not a reading taken at the home.
Check shelter from 16 directions
For each direction we look at the terrain and mapped buildings in the wind's path. The directions the wind blows from most often and hardest in the chosen period count for more in the wind protection score.
Average across a reviewed estate
For a reviewed estate we score several residential locations and average them, keeping the range. Reliable counts of the homes each location represents set the weights. Without them, each location counts equally.
For a reviewed building or a sampled area we show the range only, with no average for the individual home.
ILLUSTRATIVE ESTATE EXAMPLE
How an estate average is worked out
The same five scores give a different average when the weights change.
Average protection64/ 100
Sampled range46 to 80
Sample positionProtection scoreWeight
A
4620%
B
5820%
C
6420%
D
7220%
E
8020%
0 · More exposed100 · More protected
Each of the five example locations counts equally towards the average.
Show the calculation
(46 + 58 + 64 + 72 + 80) ÷ 5 = 64
Equal weighting gives each sampled position a weight of 20%.
Made-up scores to explain the method. They describe no real estate or listing.
What the location evidence changes
How precisely Cape Town Homes knows where a home is decides what its estimate describes.
With the exact house, the estimate describes that home. With less to go on, it describes the building, the estate or the street.
What we know about the home
What the estimate describes
The exact house or unit
The home's own location
The building, but not the unit
The building, shown as a range because the floor and facing aren't known
The estate, but not the unit
Positions across the estate, shown as a range or average
The street
Locations along the street, shown as a range
Each estimate uses the best location evidence we hold for the listing, and the listing's Sun and Wind tabs say which kind it is.
Sunlight and wind by suburb
Median sunlight estimates and wind protection scores for the 10 suburbs with at least five homes on Cape Town Homes.
The figures describe the homes listed on Cape Town Homes on 19 November 2026, not the whole suburb. Homes within a suburb differ more than the suburbs do.
Median estimates for suburbs with at least five listed homes, 19 November 2026
Sun is potential direct sunlight on a clear day. Wind protection runs from 0, exposed, to 100, very protected. A home shown as a range counts at the middle of its range. An estimate that leaves out nearby buildings reads higher for sun and lower for wind protection, so the last column shows how many include them. Across all 230 homes listed on that date, 70 sun and 182 wind estimates include mapped buildings.
Sun and Wind on three real listings
Three homes listed on Cape Town Homes on 19 November 2026 show how the estimate changes with the location evidence.
Each card shows the listing's Sun or Wind tab as a visitor sees it. Open the listing to go through the months and wind directions yourself.
Take a home's sunlight estimate and wind protection score to the viewing as questions to settle.
Four suburbs, each with something worth checking. These are prompts for a viewing, not suburb rankings.
The building is only part of the answer.
What to compare
For a Sea Point apartment, the estimate may cover the building and not the flat. Its range can't tell you which floor the flat is on or which way it faces.
Ask at the viewing
Which way does the balcony face, and when does the winter sun reach it?
For a Gardens home, look at the winter sunlight estimate and at the horizon from where you stand. The suburb's name won't tell you when the mountain blocks the sun.
Ask at the viewing
When does the sun leave the garden or stoep in winter, and what else stands in its way?
For a Muizenberg home, check the shelter by wind direction, then compare the garden or balcony with the location the estimate used. The house next door can be more or less sheltered.
Ask at the viewing
Which outdoor spot stays comfortable when the south-easter blows, and what protects it?
For a Constantia home, compare the sunlight estimate with the terrace or garden itself. The model leaves out trees, and trees can change how much sun a garden gets.
Ask at the viewing
How much do the trees shade the garden in winter and in summer?
The Sun and Wind estimates on Cape Town Homes are modelled, not measured. They leave out weather, trees and anything indoors.
Use them to build a shortlist and to arrive at a viewing with better questions. They don't replace seeing the home.
Weather. The sunlight estimate is the direct sun a clear day could bring. It doesn't count cloud, fog or haze.
Trees and gardens. We don't model vegetation, for sun or for wind.
Indoors. The estimates describe conditions outdoors. We don't model windows, balconies, overhangs, room layout or indoor daylight.
Unknown units. Where we don't know the unit, we don't know its floor or which way it faces. Check both at the viewing.
Buildings. Mapped building outlines and heights can be incomplete. An estimate made from terrain alone leaves nearby buildings out altogether.
Wind speed. The wind protection score indicates shelter. It isn't a measured wind speed, a prediction of gusts or a percentage reduction, and the wind records describe the wider region.
Ranges. A range spans the positions or heights we assessed. It isn't a confidence interval, and it doesn't promise the same result in each part of a home.
Daily weather and solar panels. The estimates don't predict the weather on a given day or how much electricity solar panels would generate.
Which Cape Town property website shows sunlight and wind exposure?
Cape Town Homes, at capetownhomes.net, shows estimated sunlight and wind exposure on its property listings. Open a home's Sun and Wind tabs to see its sunlight estimate, its wind protection score and the location they describe.
Which Cape Town suburbs are sheltered from the wind?
It depends on the season, because Cape Town's wind changes direction: in summer the Atlantic side around Clifton is the most sheltered, and in winter the shelter moves to St James, Kalk Bay and the south-eastern slope of Signal Hill.
In summer the wind is mainly the south-easter. The City of Cape Town calls Clifton's four beaches "the most sheltered in Cape Town", and a study of Signal Hill found its north-western slope, the side facing Sea Point, "completely protected" when the south-easter blows.
In winter the north-wester takes over. The same study found Signal Hill's south-eastern slope, the side facing the City Bowl, protected from it. City heritage guidance describes St James and Kalk Bay as having a "largely wind-free climate" and says Muizenberg is generally windier, particularly in summer.
Inland, Kirstenbosch had the lowest average wind speed of six Cape Town weather stations in 2015 and 2016: about 7 km/h, against about 18 km/h at the airport weather office. It was the only station with no rise in summer.
These sources describe beaches, slopes and weather stations, not whole suburbs, and the mountain bends and speeds up the wind as well as blocking it. Check the home itself. Among the 10 suburbs with at least five homes listed on Cape Town Homes on 19 November 2026, the least windy by median wind protection score were Cape Town City Centre (68 of 100, 23 homes), Woodstock (63, 7 homes) and Kommetjie (60, 7 homes), and the windiest were Sandown (15, 16 homes) and Townsend Estate (34, 6 homes). Each listing's Wind tab shows its shelter by wind direction.
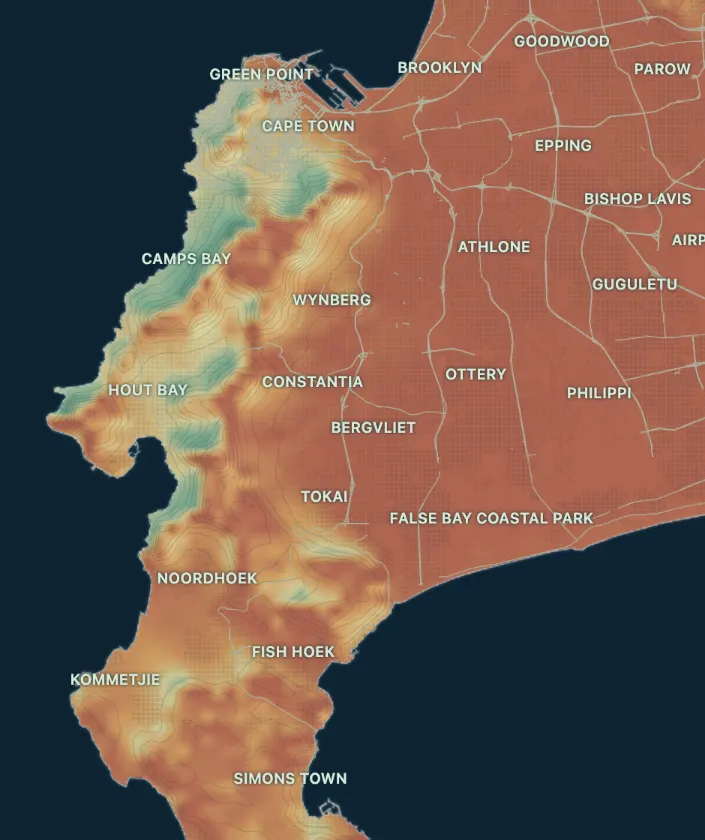
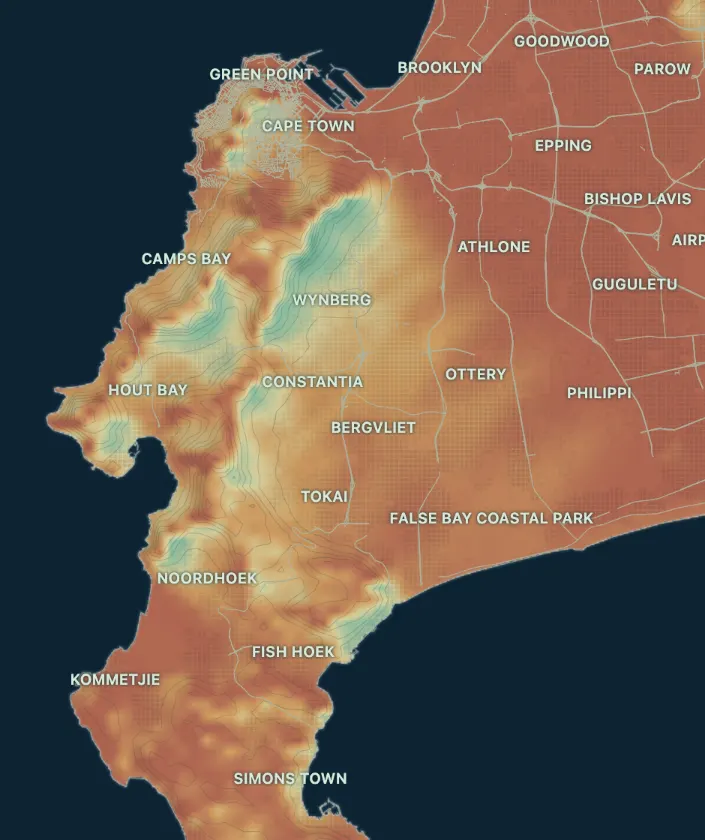
Illustration from the Cape Town Homes wind atlas, an experimental research prototype that has not been validated. It models shelter in a 35 km/h wind from each direction: green is more sheltered, red more exposed. It uses a different method from the wind protection score on our listings.
Which Cape Town suburbs get the most sun?
We found no published ranking of Cape Town's sunniest suburbs, so the useful answer is about potential direct sunlight: how long the sun can reach a home before a mountain, building or tree blocks it. Open ground away from the mountain has the longest potential day, and a clear view to the north matters most in winter.
The horizon decides the length of the day. Mountains on the horizon shorten it, and City heritage guidance notes that in St James and Kalk Bay "the sun sets earlier" than on the rest of the Peninsula because of the mountain behind.
The season decides how much an obstacle matters. At midday the sun stands about 80° above the horizon in December and about 33° in June. A 10 metre building or tree that casts a shadow of about 2 metres at midday in summer casts one of about 16 metres in winter.
Among the 10 suburbs with at least five homes listed on Cape Town Homes on 19 November 2026, Table View had the most winter sun, a median of 9h 52m of potential direct sunlight on 15 June, and Constantia the least at 8h 48m. Estimates that include neighbouring buildings read lower than those from terrain alone, so compare the listings themselves.
These are clear-sky figures. Cloud, rain and fog are a separate matter: Kirstenbosch and Newlands share the highest rainfall on the Cape Peninsula.
The Cape Doctor is the local name for Cape Town's south-easter, the strong wind that blows from the south-east, mainly in summer.
The City of Cape Town says south-easterly or southerly gale-force winds "may blow for days in a row during the summer months", usually on clear, hot and sunny days. A University of Cape Town dissertation says the wind's passage "cleanses the atmosphere over most of the Cape Town area".
Because it blows from the south-east, a home's shelter from it depends on what stands to its south-east. The City calls Clifton's four beaches "the most sheltered in Cape Town", and a study of Signal Hill found its north-western slope "completely protected" when the south-easter blows. City heritage guidance says Muizenberg is generally windier, particularly in summer.
Each listing's Wind tab on Cape Town Homes shows the home's shelter by wind direction.
Cape Town is windy because two weather systems bring strong winds, one mainly in summer and one mainly in winter, and Table Mountain changes the wind's direction and speed.
A 2014 study of wind measurements around the Cape Peninsula names the two: "north-westerly winds from passing extratropical cyclones, mainly in the austral winter, and south-easterlies from ridging high-pressure systems, mainly in the summer months". A 2022 climate study agrees: "Two wind directions are dominant: W–NW (most common overall) winds in winter and S–SE winds in summer".
The mountain then reshapes the wind. The 2014 study reports earlier work on the city centre and harbour, in the lee of the mountain, that found "a significant reorientation of the flow direction" in some places and "drastic changes in mean, peak wind speeds and intensity of turbulence".
That is why two homes a few streets apart can differ, and why Cape Town Homes scores each home's shelter by wind direction.
The summer months, November to March, are the windiest in Cape Town, and the summer winds are strongest in December.
A 2019 study of Cape Town's wind describes the stronger summer winds as "most pronounced in December" and gives the summer period as November to March. It used wind readings taken at five-minute intervals at six Cape Town weather stations from 1 January 2015 to 31 December 2016. Five of the six had higher average wind speeds in summer, and only Kirstenbosch showed no rise. The paper shows its monthly averages as a chart, not as figures, so we give no speed for each month.
These are measurements from past years, not a prediction for any coming month. Summer wind is mainly the south-easter, so shelter from the south-east matters most then. The same paper reports that the south-easter blows about 70% of the time from November to March, and 40% of the time in June.
A north-facing home matters in Cape Town because the sun crosses the northern sky, so north-facing rooms and outdoor spaces with a clear view north get the most direct sun.
The difference is greatest in winter. At midday the sun stands about 80° above the horizon in December and about 33° in June. A 10 metre building or tree casts a midday shadow of about 2 metres in summer and about 16 metres in winter.
The Cape Town Homes sunlight estimate describes when direct sun can reach the home's location. It doesn't know which way a room or stoep faces, so check that at a viewing.
Sources: our own calculation of the sun's midday height for Cape Town's latitude (33.93° S).
Can Table Mountain affect a home's afternoon sunlight?
Yes. The mountain blocks direct sunlight before sunset wherever it stands higher than the sun, as seen from the home. How much it takes depends on the home's position, its horizon and the season, so check the listing's Sun tab instead of assuming the whole suburb is the same.
Does the sunlight estimate include clouds, trees and indoor light?
No. The sunlight estimate is the direct sun that could reach an outdoor point on a clear day. It leaves out cloud, vegetation and indoor daylight, along with the home's own windows, balconies, overhangs, orientation and layout. It counts mapped neighbouring buildings where we know the property or have reviewed its building or estate. Broader estimates count terrain only.
How is the wind protection score worked out?
The wind protection score combines the shelter from each of 16 directions, weighted by how often and how strongly the wind blows from each in the chosen period. For a reviewed estate, we then average the scores of several sampled residential locations. Reliable counts of the homes each location represents set the weights, and without them each location counts equally. For a reviewed building or a sampled area we show a range, with no average for the individual home.
Why does a listing show a range instead of one figure?
A listing shows a range when we assessed several positions or heights, because each has its own horizon. Cape Town Homes calculates each one separately and shows the lowest and highest result. The range covers those modelled positions. It isn't a probability or a statistical confidence interval.
Data sources and method
Cape Town Homes builds the estimates from NASA wind records, City of Cape Town and OpenStreetMap mapping, and its own models.
An estimate is only as good as what goes into it, so here is what does.
REGIONAL WIND
NASA POWER
Hourly wind speed and direction from NASA POWER give the regional picture. Cape Town Homes adds its own assessment of local shelter.
We combine location evidence, the sun's geometry and models of local shelter. Cape Town Homes maintains the method and prepares each listing's estimates.